


A recent Facebook outage is a vivid example of how damaging hours of downtime could have on users and businesses. Users will churn if your service becomes inaccessible, sluggish, or unreliable. To prevent service deterioration (since everything fails), your engineers need fast and full visibility into your production systems.
Modern applications generate tons of metrics, including infrastructure and host metrics like CPU usage, APM metrics like database metrics, response time, and more. Having a 360-degree overview of these metrics is not trivial as it’s not feasible to monitor all of these plethoras of hosts and infrastructure metrics at the same time.
This is why the four golden signals were created by Google Site Dependability Engineers to help DevOps teams monitor the health of their systems, ensure the service's reliability, discover any possible flaws, and take action to fix any issues. In this post, you’ll learn what exactly are golden signals and how to leverage them.
The Four Golden Signals of Monitoring
The golden signals originated from Google. Google's Site reliability engineers (SREs) developed four critical indicators to track. These indicators are latency, traffic, errors, and saturation and are referred to as the "four golden signals." The golden signals are similar to the RED microservices metrics of rate, errors, and duration, as well as the earlier USE approach of utilization, saturation, and errors.
In the next paragraphs, we’ll look at them in detail.
These four signals should be included in your service level objectives (SLOs) because they are crucial for delivering quality services. These four golden signals are necessary for providing a positive client experience. Furthermore, developing a successful monitoring plan requires the use of the four golden signals for monitoring. Follow through to understand the functionality of each signal.
Latency
Latency is measured in (ms/s) and it is the time it takes to send a request and receive a response. You can think of latency as how long you’re waiting for a response. To account for changes in network speed, latency is generally assessed from the server side, but it can also be measured from the client-side. Your engineers have the most control over server-side latency, users will be most concerned with client-side delay.
It's also crucial to understand if or not stressors in your application's environment are influencing your end-users.
Deciding the acceptable thresholds for latency can vary from application to application. Depending on your objectives, SLOs, and the type of application, you can set a different target threshold. An API or ad server may need to respond considerably faster than a human interacting with a user interface on a mobile phone.
But latency is not just a measure of how long a successful request and response take alone. It’s important to note that both successful and unsuccessful requests involve latency, and it's critical to understand the difference between the two.
Because unsuccessful requests frequently fail quickly without additional processing, you should track the latency of both successful and failed requests separately. An HTTP 500 error, for example, prompted by a database connection failure, might be served quickly. However, because HTTP 500 indicates a rejected request, including it in the overall latency will be misleading.
Traffic (Demand Per User)
The quantity of requests traveling across the network in demand per user is referred to as traffic. You can think of traffic as the HTTP requests to a web server or API, or messages sent to a processing queue. One might ask why is traffic such an important metric? Traffic in the real world is not linear such as events in the real world are not linear. A news publication could cause an increase or decrease in traffic which has a direct implication on your infrastructure.
Peak traffic periods can put additional strain on your infrastructure, pushing it to its limits and causing downstream repercussions. Traffic is a crucial indicator because it distinguishes capacity issues from poor system designs, which can cause issues even when traffic is minimal. It can also help you design capacity ahead of time for distributed systems to meet expected demand.
Errors
The percentage of requests that fail, either implicitly (i.e an HTTP 200 success response with the erroneous content), or directly. That is, the percentage of requests ending up with HTTP status codes 500, 501, 503, and more. The error rate is a good indicator of underlying problems in distributed systems. A spike in error rate after a release could indicate bugs in the release or broken configuration in the release. Errors should reveal service misconfigurations, application problems, and dependency failures. Other metrics, such as delay and saturation, might be influenced by error rates.
Saturation
The overall capacity of a service, or how "full" it is at any particular time, is referred to as saturation. Every resource has a performance limit beyond which it degrades, becomes unavailable, or causes packets to be dropped. This is true for CPU use, disk capacity, RAM utilization, and operations per second. Saturation is often preceded by an increase in latency. Saturation can be detected early by measuring your 99th percentile response time over a short time span. A 99th percentile latency of 60 ms, for example, means that one out of every 100 requests will be delayed by 60 ms.
Many systems begin to perform poorly before they reach 100% utilization. As a result, setting a utilization target is crucial since it will assure service availability and performance for your users.
Measuring the Golden Signal
Taking this example, We've installed a basic Go application using Prometheus instrumentation as an example of how Golden Signals can be used. In order to provide usable latency statistics, this program will impose a random delay between 0 and 12 seconds. Curl will be used to generate traffic, with multiple endless loops.
A histogram has been included to capture metrics related to latency and requests. These indicators will assist us in determining the first three golden signals: latency, error rate, and request rate. We'll use Prometheus and node-exporter to get saturation utilizing – in this case – the percentage of CPU in the nodes. Assuming you have an endpoint that performs the business function of greeting people. When you call this endpoint, “Hello” is returned to your browser. We can instrument the endpoint as follows:
package main

import (
"fmt"
"log"
"math/rand"
"net/http"
"time"

"github.com/gorilla/mux"
"github.com/prometheus/client_golang/prometheus"
)

func main() {
// Prometheus: Histogram to collect required metrics
histogram := prometheus.NewHistogramVec(prometheus.HistogramOpts{
Name: "greeting_seconds",
Help: "Time take to greet someone",
Buckets: []float64{1, 2, 5, 6, 10}, //defining small buckets as this app should not take more than 1 sec to respond
}, []string{"code"}) // this will be partitioned by the HTTP code.

router := mux.NewRouter()
router.Handle("/sayhello/{name}", Sayhello(histogram))
router.Handle("/metrics", prometheus.Handler()) //Metrics endpoint for scrapping
router.Handle("/{anything}", Sayhello(histogram))
router.Handle("/", Sayhello(histogram))
//Registering the defined metric with Prometheus
prometheus.Register(histogram)

log.Fatal(http.ListenAndServe(":8080", router))
}

func Sayhello(histogram *prometheus.HistogramVec) http.HandlerFunc {
return func(w http.ResponseWriter, r *http.Request) {

//monitoring how long it takes to respond
start := time.Now()
defer r.Body.Close()
code := 500
defer func() {
httpDuration := time.Since(start)
histogram.WithLabelValues(fmt.Sprintf("%d", code)).Observe(httpDuration.Seconds())
}()

if r.Method == "GET" {
vars := mux.Vars(r)
code = http.StatusOK
if _, ok := vars["anything"]; ok {
//Sleep random seconds
rand.Seed(time.Now().UnixNano())
n := rand.Intn(2) // n will be between 0 and 3
time.Sleep(time.Duration(n) * time.Second)
code = http.StatusNotFound
w.WriteHeader(code)
}
//Sleep random seconds
rand.Seed(time.Now().UnixNano())
n := rand.Intn(12) // n will be between 0 and 12
time.Sleep(time.Duration(n) * time.Second)
name := vars["name"]
greet := fmt.Sprintf("Hello %s \n", name)
w.Write([]byte(greet))
} else {
code = http.StatusBadRequest
w.WriteHeader(code)
}
}
}
We used Prometheus and Grafana to monitor the app after deployment to a Kubernetes cluster.
Latency
sum(greeting_seconds_sum)/sum(greeting_seconds_count)  //Average
histogram_quantile(0.95, sum(rate(greeting_seconds_bucket[5m])) by (le)) //Percentile p95
Request Rate
sum(rate(greeting_seconds_count{}[2m]))  //Including errors
rate(greeting_seconds_count{code="200"}[2m])  //Only 200 OK requests
Error Per Second
sum(rate(greeting_seconds_count{code!="200"}[2m]))
Saturation
We utilized the node-exporter cpu percentage:
100 - (avg by (instance) (irate(node_cpu_seconds_total{}[5m])) * 100)
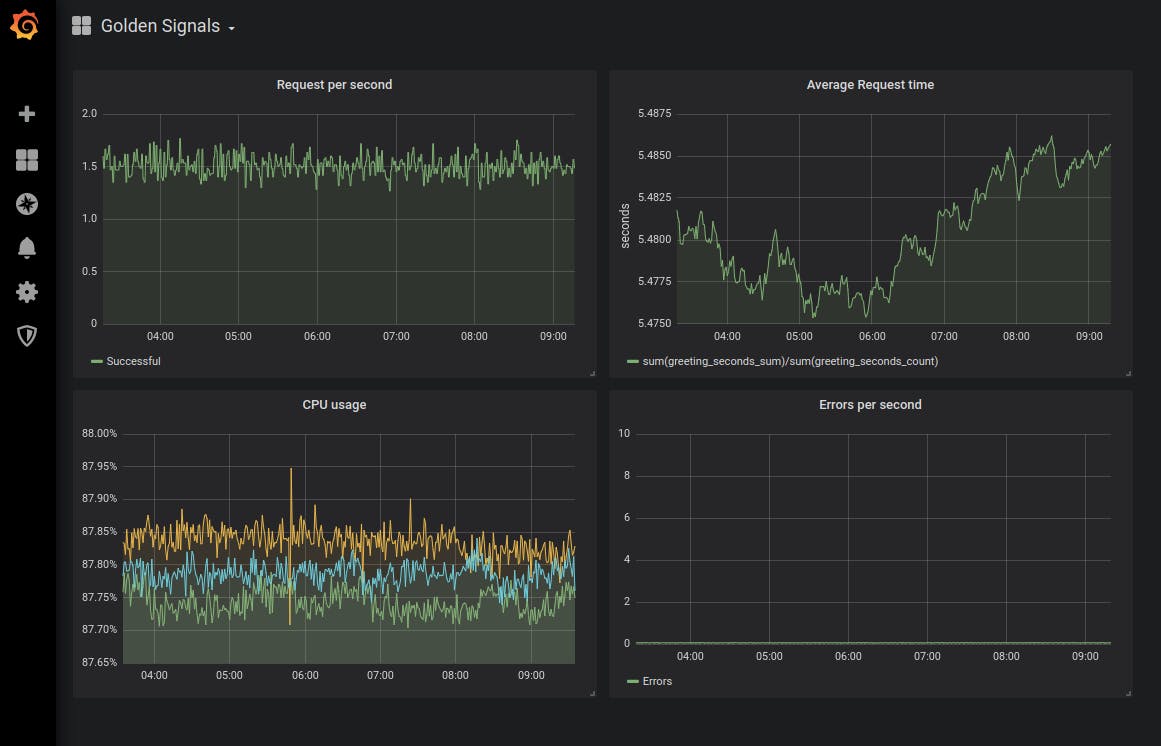
Result Dashboard
As a result, we have this dashboard with Golden Signals:
Benefits and Importance of the Four Golden Signals
Golden signals are measurements that indicate the most essential characteristics of the functions of your service. Because there are so many metrics you can possibly monitor, monitoring large systems becomes complex, resulting in more faults and warnings. It's a lot easier to evaluate whether the operating platform or application requires any further monitoring once the signals are in place. These signals when used can be of huge benefit in the following way:
Sending warnings and alerts
The logs of application runtimes are being watched in order to infer a causal relationship between the golden signal errors
White-box monitoring - Monitoring based on metrics accessible by the system's internals, such as an HTTP handler emitting internal data, interfaces such as the Java Virtual Machine Profiling Interface, or just logs.
Monitoring user experience
Creating effective dashboards that give data on the component being monitored Utilizing metrics data to test hypotheses and implement AIops capabilities
Aiding prompt response when something goes wrong - When the signals drop too low, the response team is notified of an incident, allowing them to identify the cause and act to resolve it.
Aiding capacity planning - Which is used to track and enhance performance over time. Can be used in analyzing long-term trends.
Collect and store metrics data for querying and performance normalcy and trends for the monitored service.
Golden signals vs. RED method vs. USE method
We’ve discussed the four golden signals, but there are other approaches for monitoring distributed systems. These approaches are known as the RED and the USE method. In this section, we’ll explore the differences.
While the four golden signals are regarded as the most significant for analyzing latency, traffic, errors, and saturation in a user-centric system, in the other approaches, we don't use those four metrics exactly; instead, depending on what we're monitoring, we use one of two methods based on a subset of those four metrics: the RED method for HTTP metrics and the USE method for infrastructure.
The RED Method
The main difference between the four golden signals and the RED approach is that the RED approach is a subset of the golden signals focused on HTTP metrics suitable for microservice architectures. The RED approach measures the following metrics:
- Rate: The number of requests served per second by your service.
- Error: The number of unsuccessful requests per second.
- Duration: The amount of time it takes to complete or process a request.
Measuring these metrics is simple, especially with tools like Prometheus, and using the same metrics for each service allows us to develop a consistent and easy-to-read style for dashboards that must display the information.
The USE Method
The USE Method is mainly focused on infrastructure monitoring, where physical resources must be kept under control, and is based on only three parameters: Utilization: The percentage of a resource that has been utilized; at 100% utilization, no additional work can be accepted;
- Saturation: The amount of extra work that a resource can't handle, which results in a backlog;
- Errors: The number of times an error occurred. The USE Method assists in identifying problems that could be system bottlenecks and implementing appropriate countermeasures, but it necessitates careful examination due to the complexity of systems.
Tools to Monitor Golden Signals
Another crucial step in the SRE journey is choosing monitoring tools to track the golden signals. Depending on your demands, you can select between free and paid tools. Both free and premium monitoring solutions come with dashboards for default metrics, as well as the ability to set up alerts and notifications.
Open-source Monitoring Tools
If you have a restricted tooling budget, open-source monitoring tools are a wonderful option. The source code is accessible to the user in open-source tools, allowing them to tweak it to their needs and incorporate it into their system. Customization, on the other hand, is time-consuming and necessitates subject knowledge. Finally, you are responsible for the availability, tool's security, and updates. The following are some excellent open-source monitoring tools: Nagios Netdata Prometheus + Grafana Cacti Zabbix Icinga.
Managed Monitoring Tools
Managed monitoring solutions, on the other hand, are more expensive, but they provide a level of reliability that open-source monitoring tools lack. You won't be responsible for the monitoring system's security, upgrades, or availability, and you'll get expert help integrating it.The following are a some of the most widely used managed monitoring tools: Datadog AppDynamics Prometheus New Relic Honeycomb Pingdom.
Summary
In conclusion, the four golden signals discussed in this post should be included in your service level objectives (SLOs) because they are crucial for delivering quality services. These four golden signals are necessary for providing a positive client experience. Furthermore, developing a successful monitoring plan requires the use of the four golden signals for monitoring.